
Group Progress report
This report shows the linear progress of a group for one subject/profile over a time period. It is a quick and simple visual overview of each pupil's linear progress and attainment.
This report, by default, is a bar chart and shows how each student's attainment changes over two dates, showing the progress made. You can choose to add an additional date to show a midpoint and how the rate of progress may have increased or decreased over time.
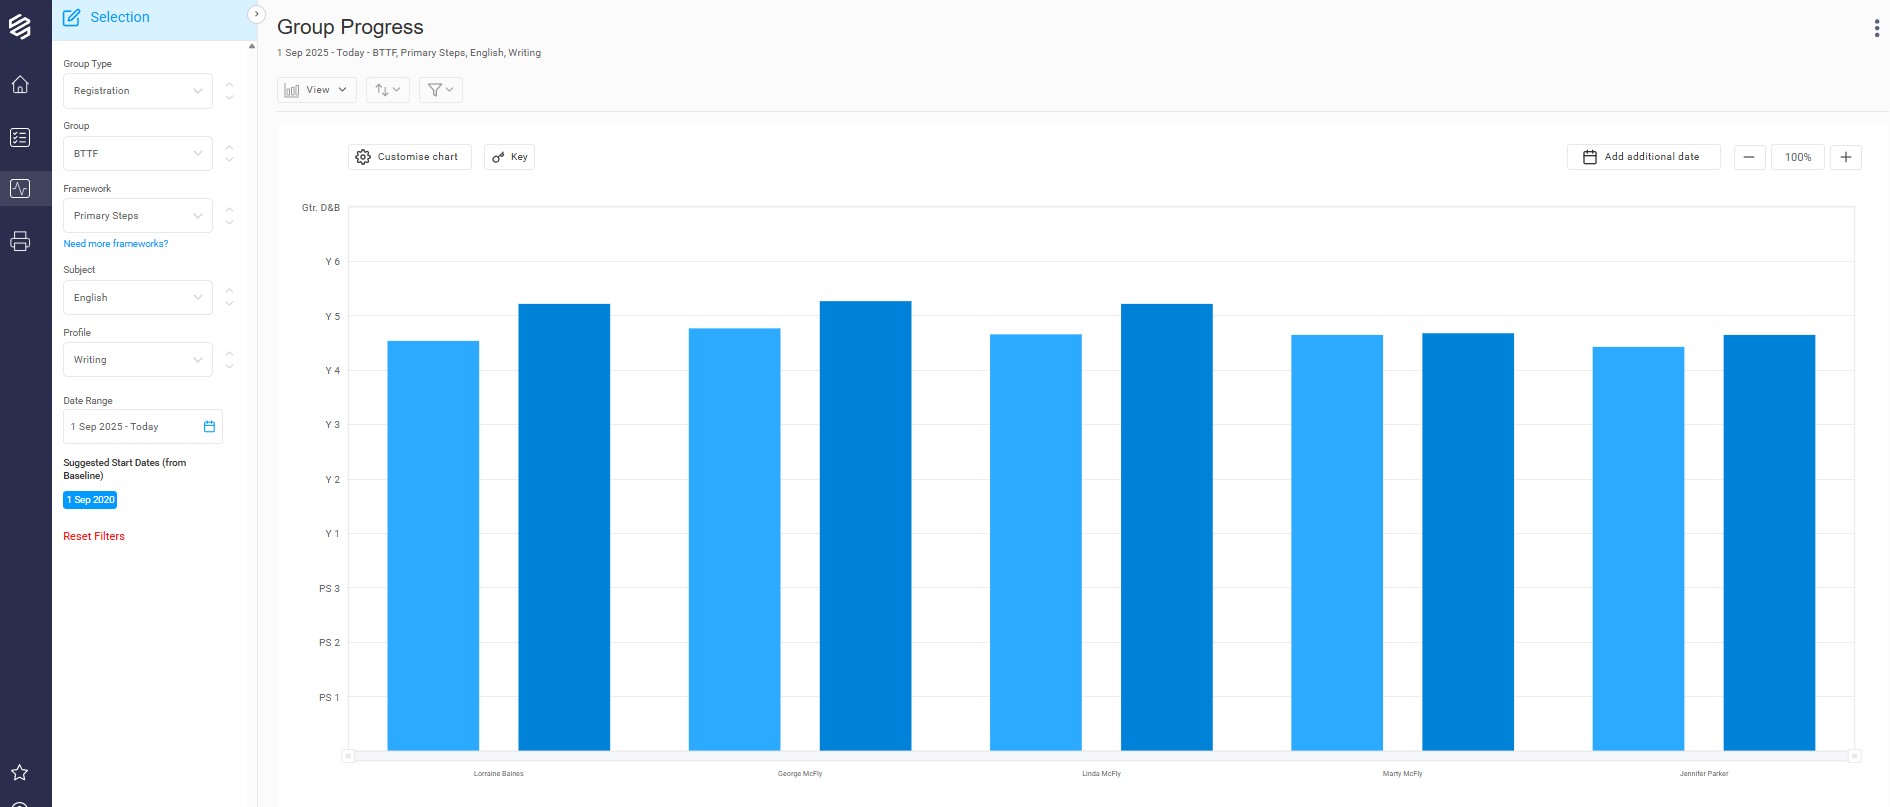
The data can be represented as a comparative bar chart, in columns or as a line chart.
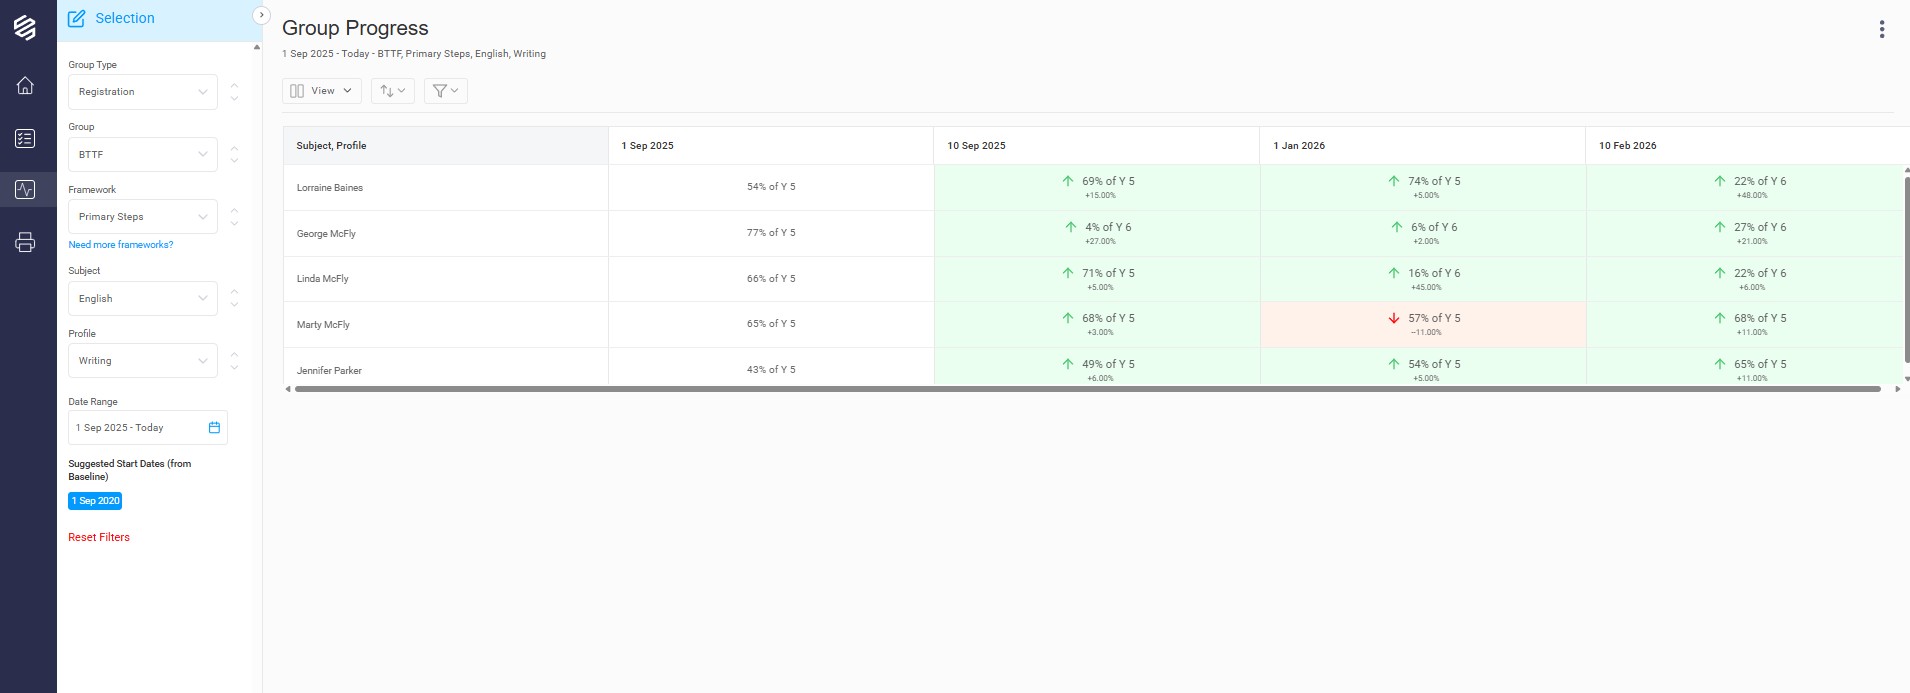
In the column view, the green and red indicators are a good visual representation of change over time. They represent whether a pupil has progressed or regressed since the previous date. The dates used are the school's Key Dates as set in My BSquared. To learn about managing your Key Dates, please see https://support.bsquared.cloud/article/779-set-key-dates.
At the top of the chart, there may be an 'i' icon. This will show you any students in the group that have been omitted from the report because they are not on the framework or have not been baselined as at the report start date.